🚀
My Projects
🖥️
Proxmox Cluster
High-availability cluster setup with two Proxmox nodes for virtualization and container management.
ProxmoxLXCHigh Availability
☸️
Kubernetes Cluster
K3s cluster using Lenovo ThinkCentre and Raspberry Pis for cloud-native applications.
KubernetesK3sRaspberry Pi
📺
Media Server
Plex and Jellyfin media servers with automated content management using Sonarr, Radarr, and Lidarr.
PlexJellyfinAutomation
📊
Monitoring Stack
Comprehensive monitoring solution using Prometheus, Grafana, and various exporters.
PrometheusGrafanaMonitoring
Proxmox Monitoring Stack
📈A comprehensive monitoring solution that combines InfluxDB and Grafana to provide real-time insights into your Proxmox cluster's performance.
✨Key Features
- •Real-time performance monitoring
- •Customizable Grafana dashboards
- •Scalable for any cluster size
- •Intuitive data visualization
- •Automatic node detection
Real-time Proxmox monitoring dashboard
🔧Tech Stack
•InfluxDB 2.x
•Grafana
•Docker Compose
•Proxmox VE API
🚀Quick Start
git clone https://github.com/ahmed86-star/Proxmox-InfluxDB-Grafana.gitcd Proxmox-InfluxDB-GrafanaMonitoringProxmoxGrafanaInfluxDBDocker
📊
InfluxDB
Time Series Database
High-performance time series database for monitoring and analytics.
Key Features
- •Real-time performance monitoring
- •Customizable Grafana dashboards
- •Scalable for any cluster size
- •Intuitive data visualization
- •Automatic node detection
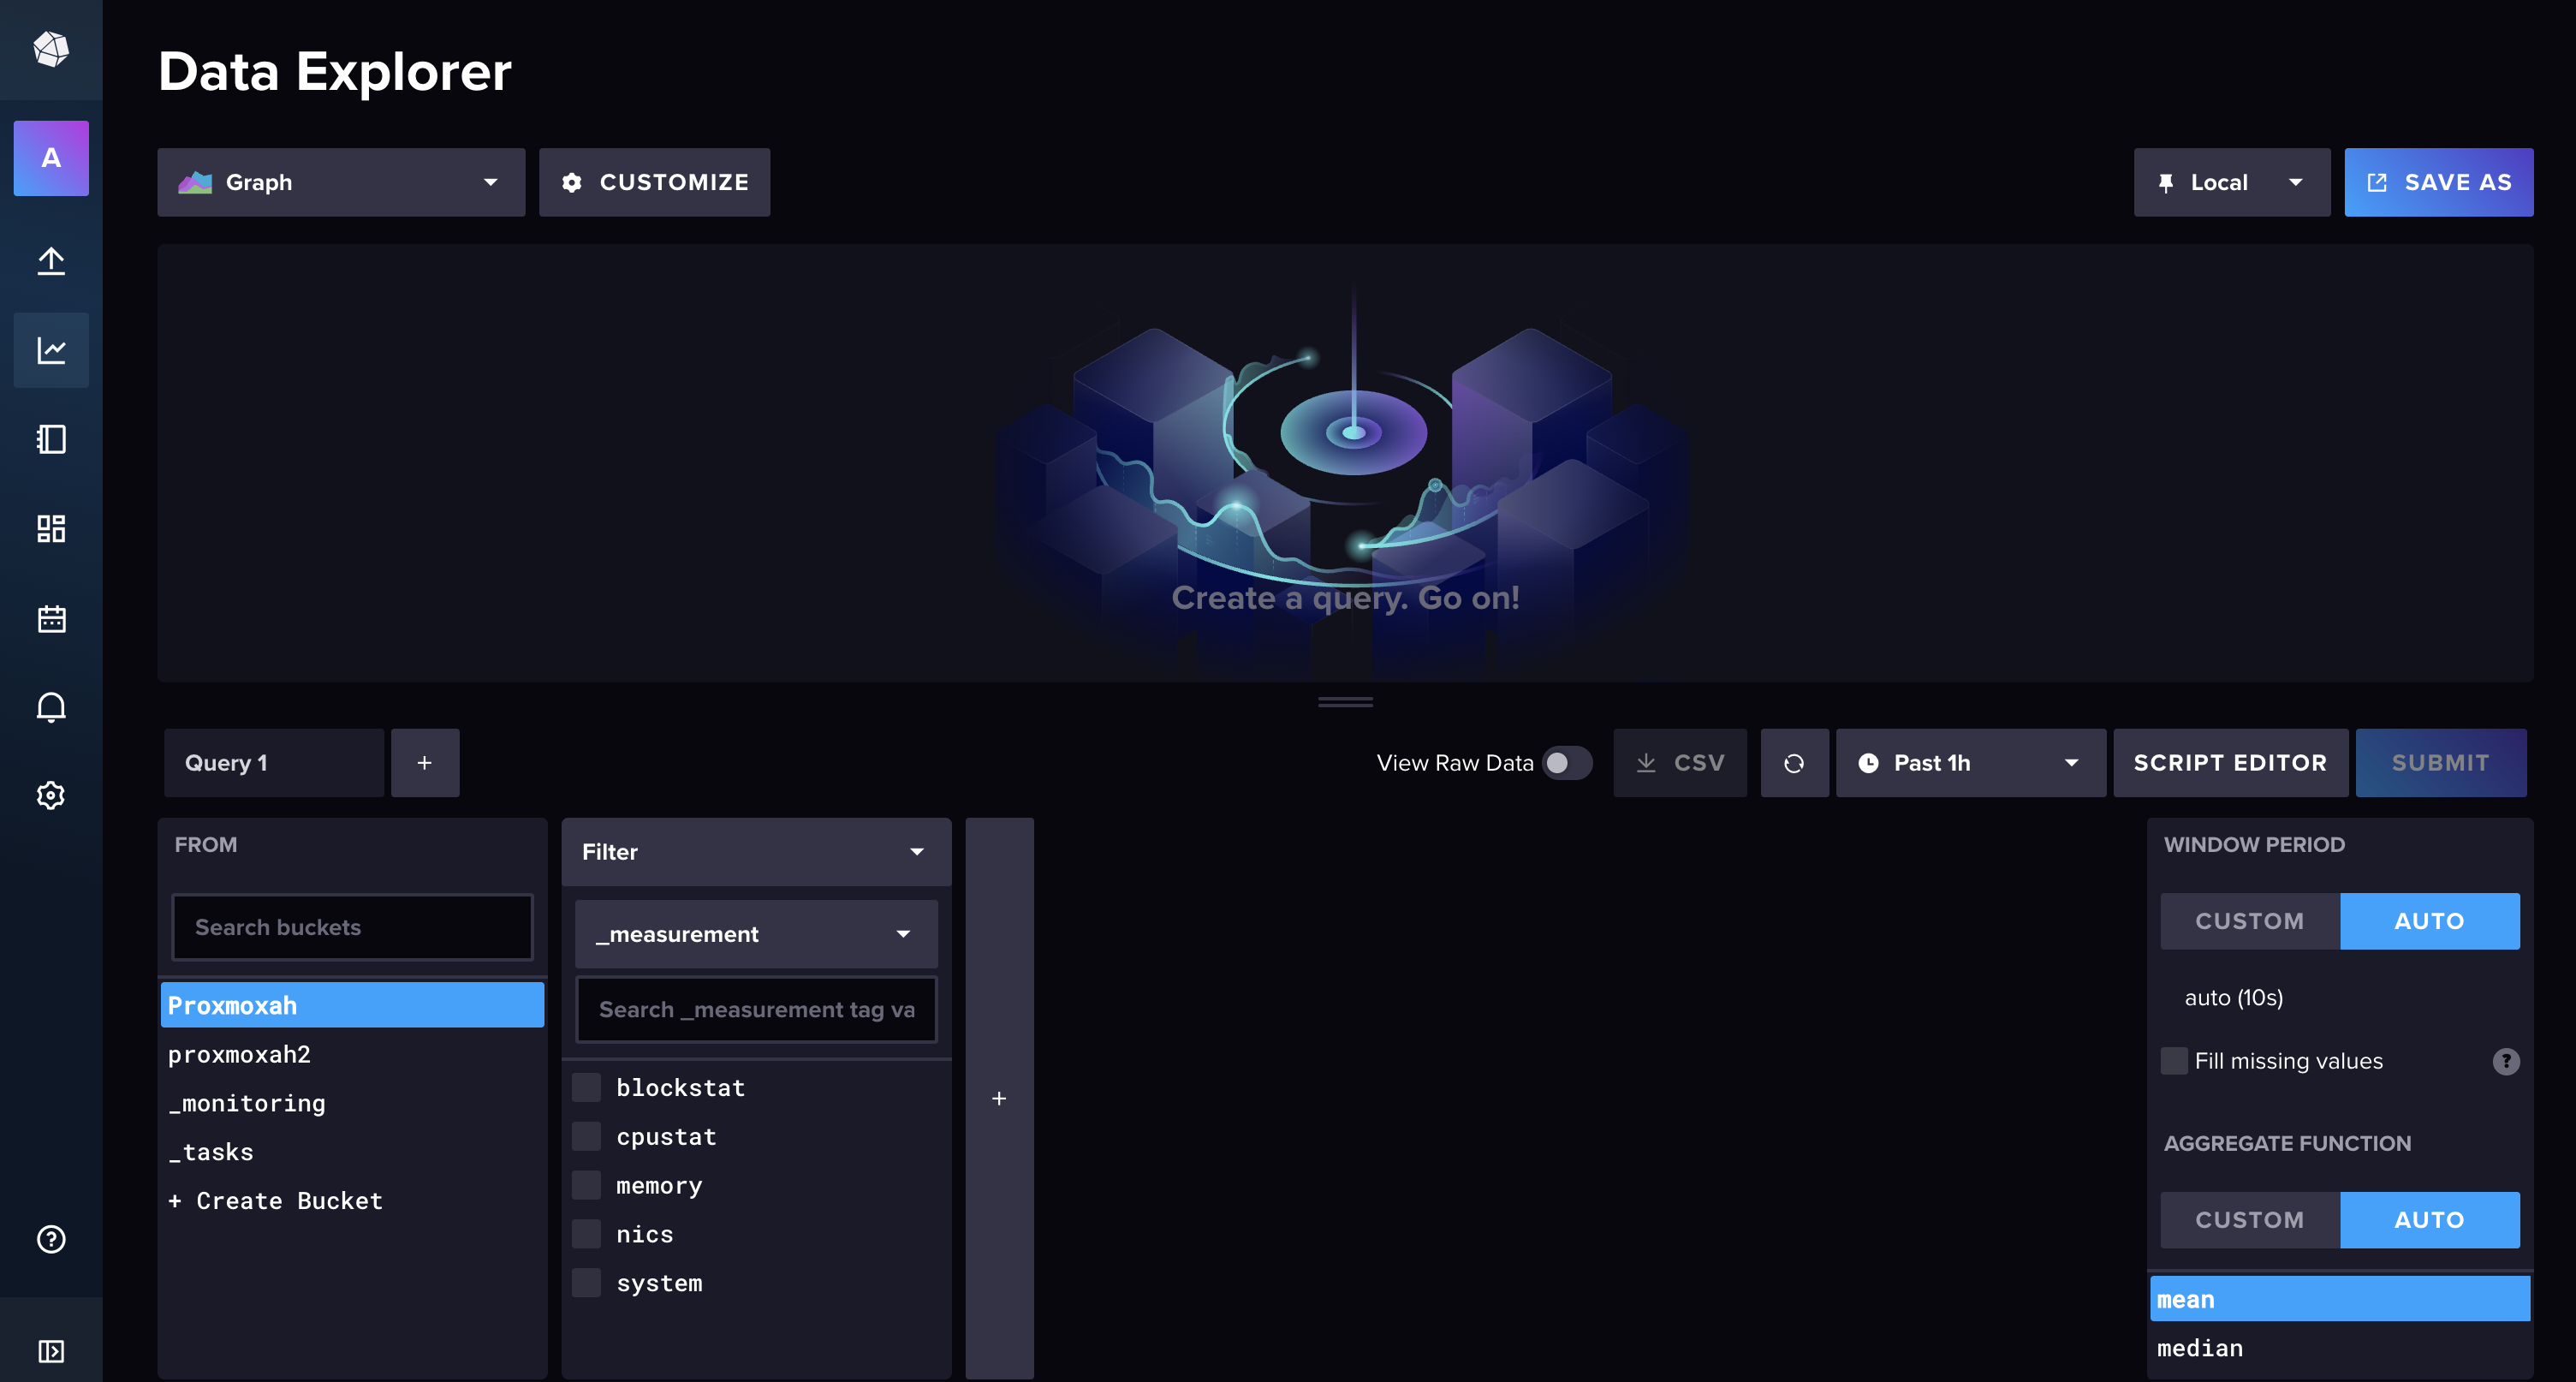
InfluxDB Dashboard
Real-time monitoring dashboard
Time SeriesMonitoringAnalytics